Flow of young voters between 2024 and 2026: Sankey diagrams from NORC's Civic Health & Elections Project
The youth vote mattered in 2026. CIRCLE’s analysis of the 2026 election shows how young people ages 18 to 29 shaped the midterms.
On election night and in the days after, most of the attention goes to how people voted. Young voters favored Democrats for the House by a larger margin than in any other age group.
In 2024, young voters were more evenly divided: 54% voted for Kamala Harris and 43% for Donald Trump. Comparing a presidential vote to a House vote is not apples to apples, so the closer comparison is the 2024 House vote, when 56% of young voters chose a Democrat and 42% a Republican. In 2026, the SSRS Voter Poll shows 73% of young voters chose a Democrat and 25% a Republican. Given that jump, it is tempting to describe 2026 as a youth “swing,” but the story is more complex. We have to account for how young people new to the electorate (an estimated 8.5 million in 2026) voted, and for large shifts in who stayed home and who showed up.
The data behind the diagrams
I’ve been digging into what NORC’s Civic Health & Elections Project (CH&EP) tells us about young voters. Like the SSRS Voter Poll, CH&EP collected data in the days leading up to and including Election Day. What sets it apart is that it also surveyed registered people who did not vote, and its very large sample (more than 110,000 registered voters) makes it possible to look closely at subgroups like young people. The full dataset, along with tools for exploring it, is publicly available.
Because CH&EP includes both voters and nonvoters, it made possible the visualizations I am sharing below. The first is a Sankey diagram that shows how young people’s vote choices shifted alongside whether they voted at all.
Sankey diagrams are among my favorite data visualizations. As a developmental researcher, I have used them to illustrate latent profile transition analyses (LPTA), which show how young people move between profiles from one wave of data to the next.
The CH&EP data are cross-sectional, so the movement from 2024 to 2026 in these diagrams is constructed from a survey question that asked respondents to recall their 2024 vote. Even so, the diagrams tell a layered story.
Where young voters came from and went
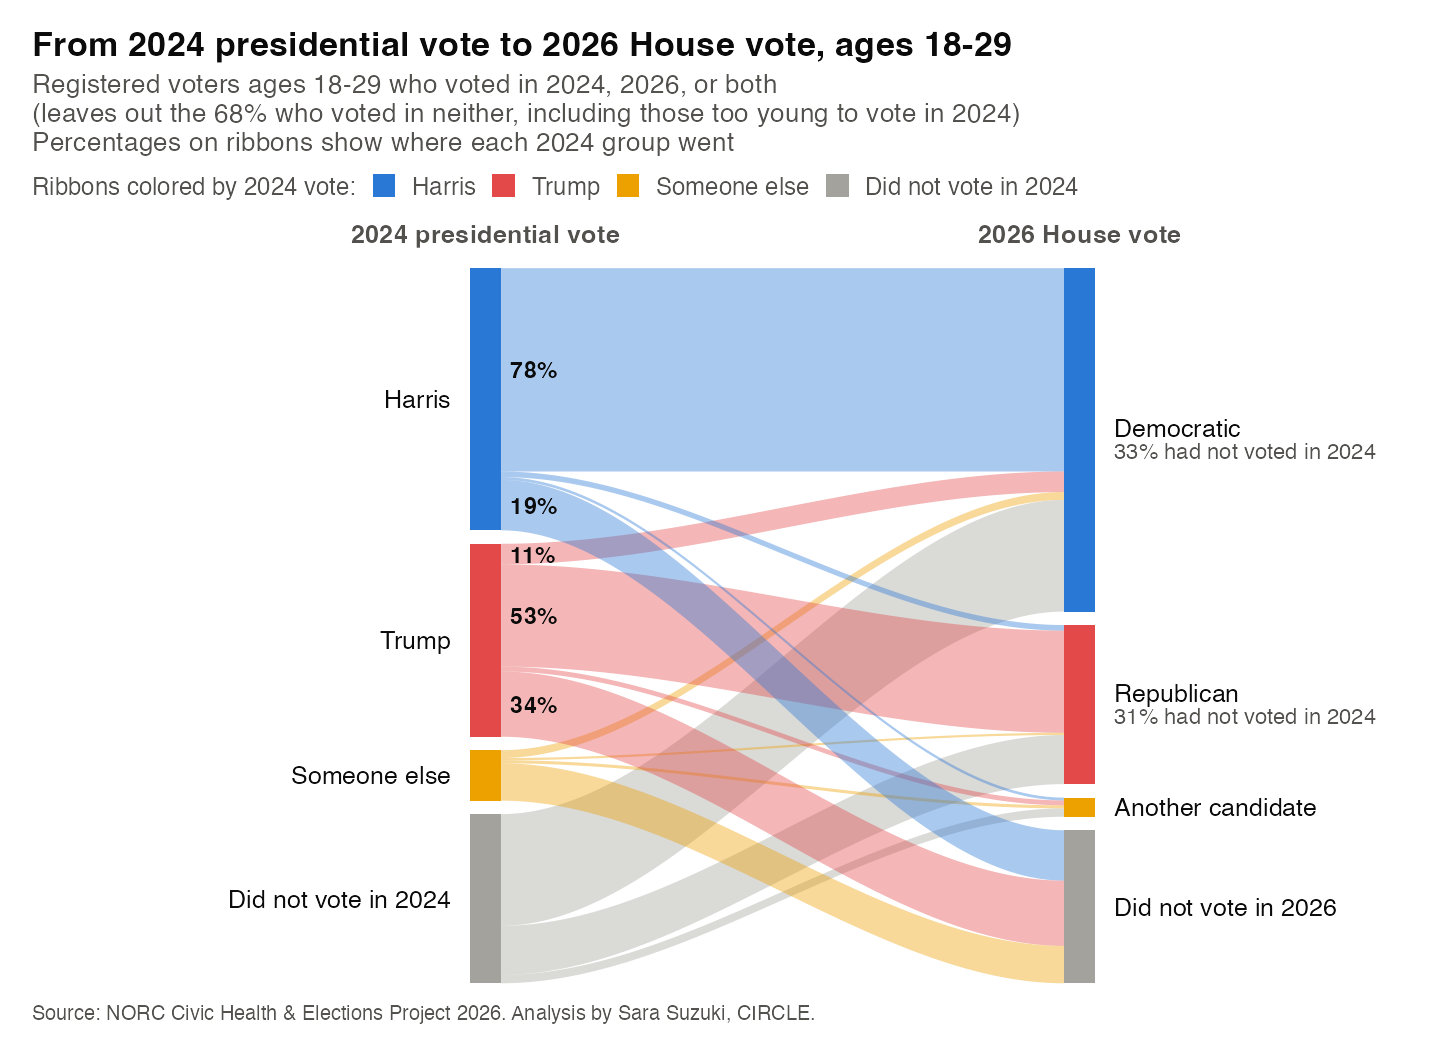
This analysis covers only young people who were registered to vote in 2026; the survey does not include those who are not registered. Among registered young people who voted for a Democrat for the House, about a third (33%) had not voted in 2024, either because they were too young or because they did not vote that year. The same was true of 31% of those who voted for a Republican. These new voters favored Democrats by more than two to one. In other words, the young electorate of 2026 was not simply the 2024 electorate minus the people who stayed home.
Young 2024 voters who were still registered in 2026 also moved. Young Harris voters mostly stayed with Democrats: 78% voted for a Democrat for the House, and 19% did not vote. Young Trump voters were much less consistent: 53% voted for a Republican, 34% did not vote, and 11% voted for a Democrat.
How young and older voters compare
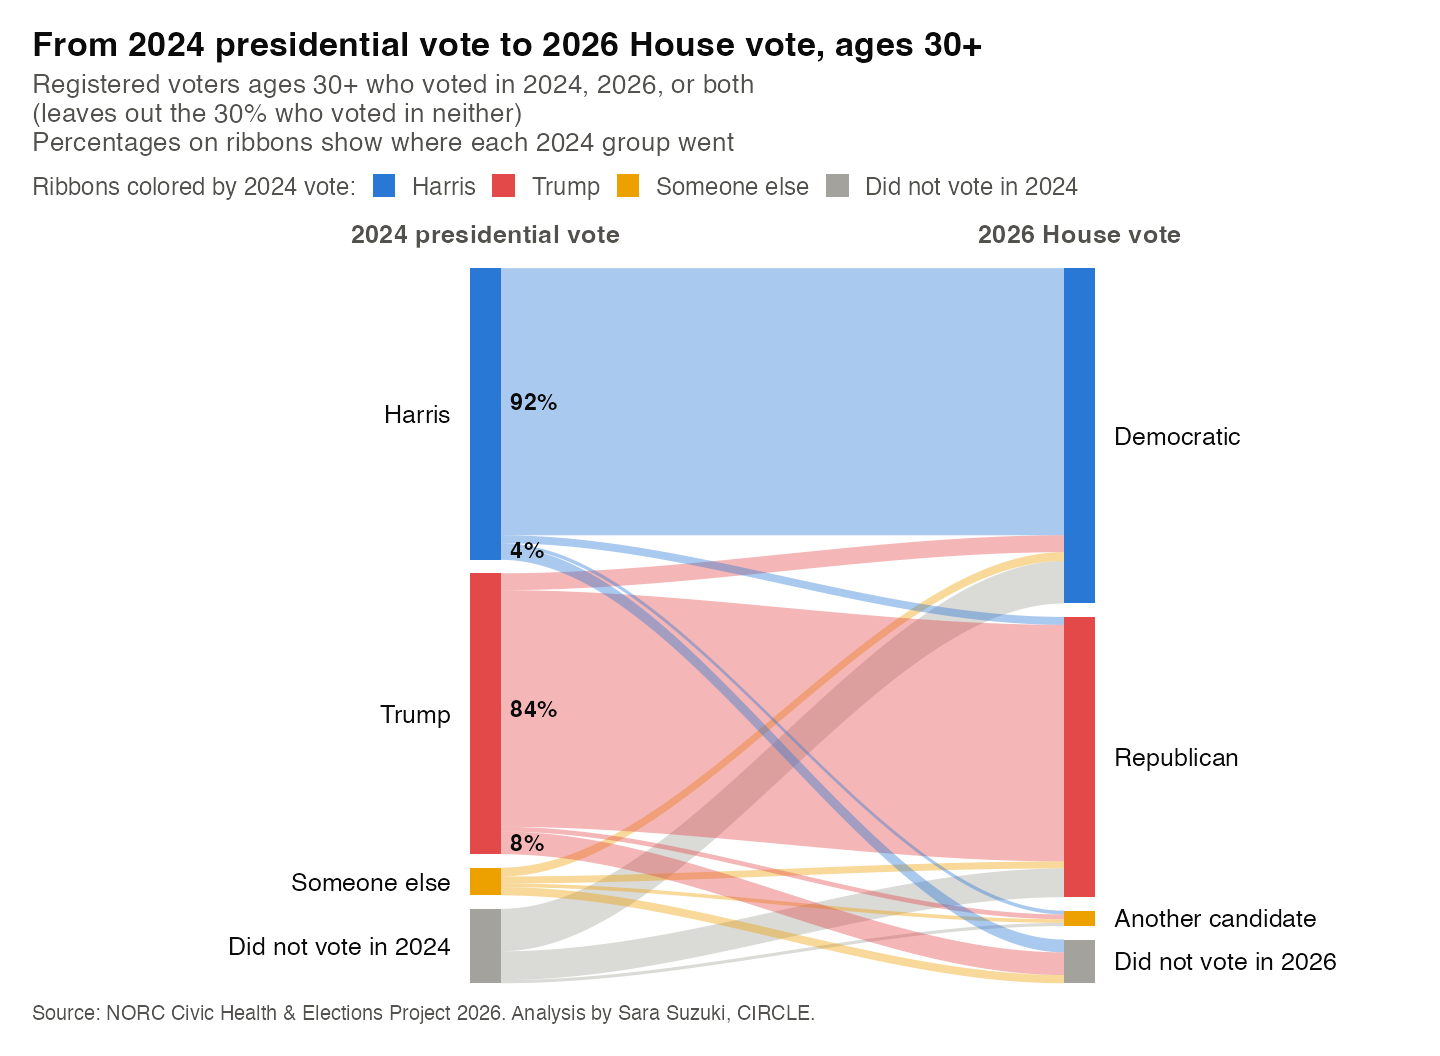
The larger point is about who votes. Registered young people moved in and out of the electorate far more than they switched parties, and far more than older adults did. Among registered voters 30 and older, 92% of Harris voters and 84% of Trump voters backed their party’s House candidate, and only 4% of Harris voters and 8% of Trump voters stayed home. For young people, whether someone votes at all shapes the electorate more than which party they choose.
This is consistent with what we know about civic development. Political identities are still taking shape in the late teens and twenties, and whether a young person votes in a given year depends a great deal on the support and information they receive.
The biggest ribbon is gray
The charts above leave out registered people who voted in neither election. Adding back the young people who did not vote changes the picture.
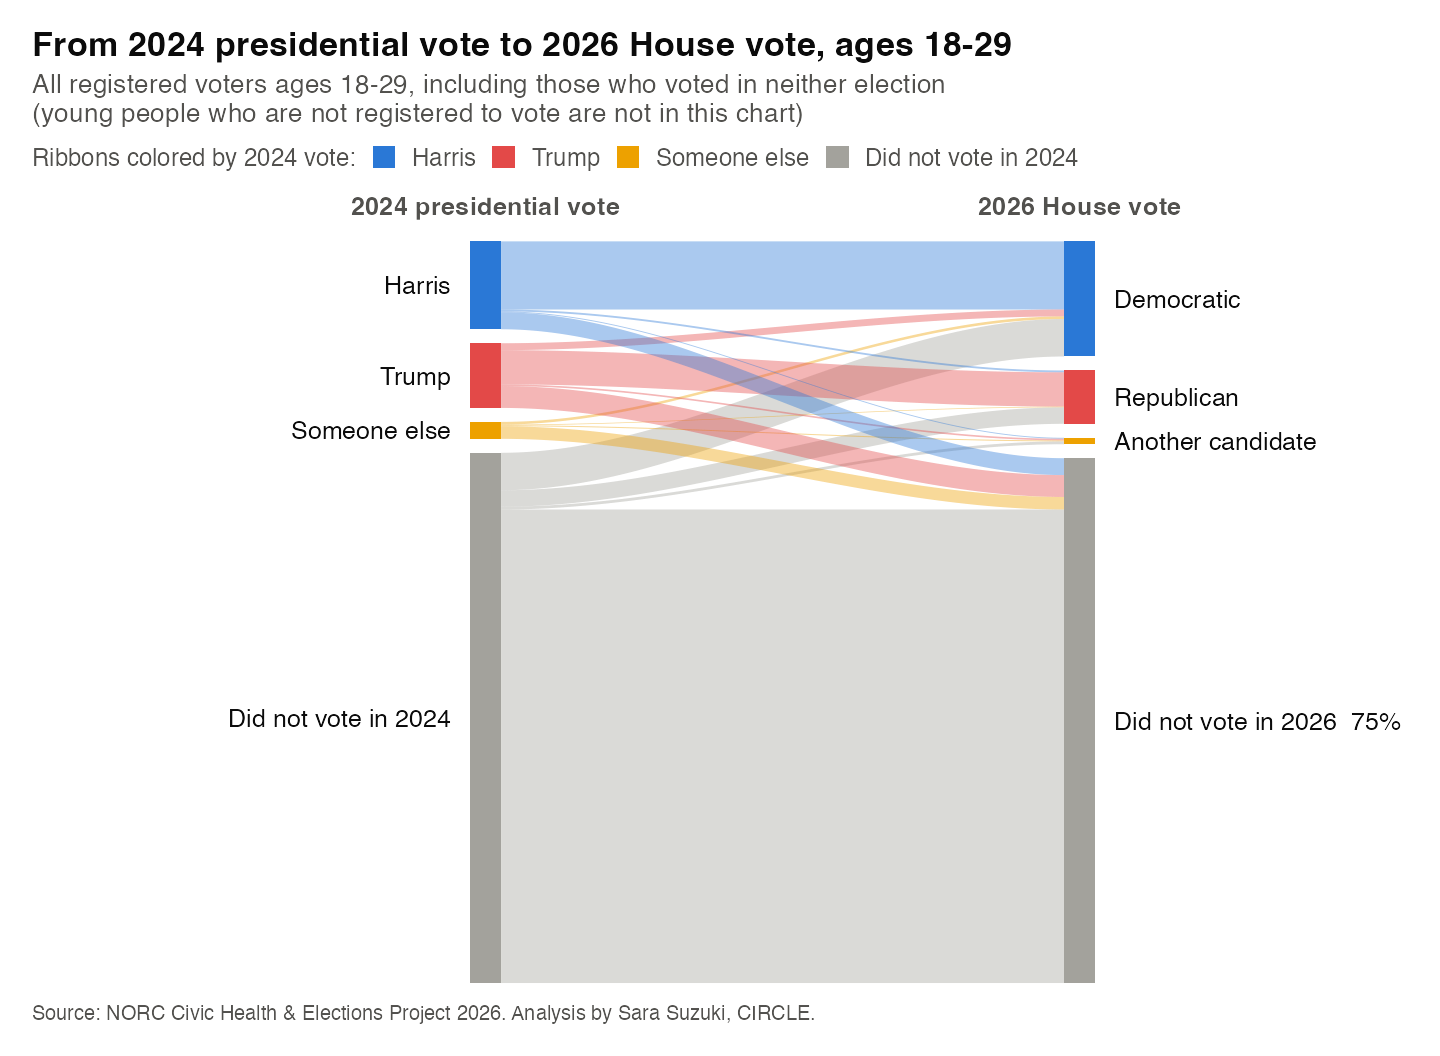
By NORC’s likely-voter estimate, three in four registered young people in the survey did not vote in 2026, and most of them had not voted in 2024 either. Next to that wide gray ribbon, the Harris and Trump ribbons look thin.
Even this chart understates the gap, because it only includes young people who are registered. By the Census Bureau’s standard measure from the Current Population Survey, nearly half of U.S. citizens ages 18 to 29 were not registered to vote in the last two midterms: 47% in 2018 and 46% in 2022 (see the notes below for caveats). Far more young people are outside the electorate than vote for either party.
Who makes up the young electorate also matters. Looking at which groups of young people are overrepresented among voters, and which are underrepresented, reveals inequities in our democracy. When the same young people are consistently left out, their voices carry less weight in who wins and which issues get attention.
Looking toward 2028
Young people’s votes moved far more between 2024 and 2026 than older adults’ did, and many registered young people who did not vote are not attached to a party: 41% identify with neither party, about twice the share among young voters.
The support and connection young people find between now and 2028 will shape how these ribbons look next time. CIRCLE’s research on political homes shows that young people with a place to belong, build their voice, and act on the issues they care about are more likely to vote. Our democracy needs the energy and participation of all young people, including the many who did not vote this time.
Notes
- Survey: NORC at the University of Chicago fielded the Civic Health & Elections Project between October 26 and November 3, 2026, concluding as polls closed on Election Day, surveying more than 110,000 registered voters in all 50 states. All estimates use NORC’s survey weights. See NORC’s public methods statement for details.
- 2026 vote: whether a respondent voted in 2026 is based on NORC’s likely-voter model, not confirmed turnout records.
- 2024 vote: respondents recalled their 2024 vote two years later. Everyone in the survey was registered in 2026, so “Did not vote in 2024” includes young people who were too young to vote or not yet registered then; it is not a measure of 2024 turnout. About one in ten young people who recall voting in 2024 say they voted for someone other than Harris or Trump, well above the third-party share that year. It is possible that some now remember their 2024 vote differently.
- Registration: CH&EP surveys registered voters only. The 2018 and 2022 registration figures are my calculations from the Census Bureau’s Current Population Survey Voting and Registration Supplement (Table 1, citizens ages 18 to 29; 2018, 2022). Following standard Census practice, people who did not answer the registration question are counted as not registered. Counting only those who answered, about 31% of young citizens were not registered in each year. These figures are also self-reported, and surveys tend to overstate registration, so the true share of unregistered young citizens likely falls somewhere between these two estimates.
Comments